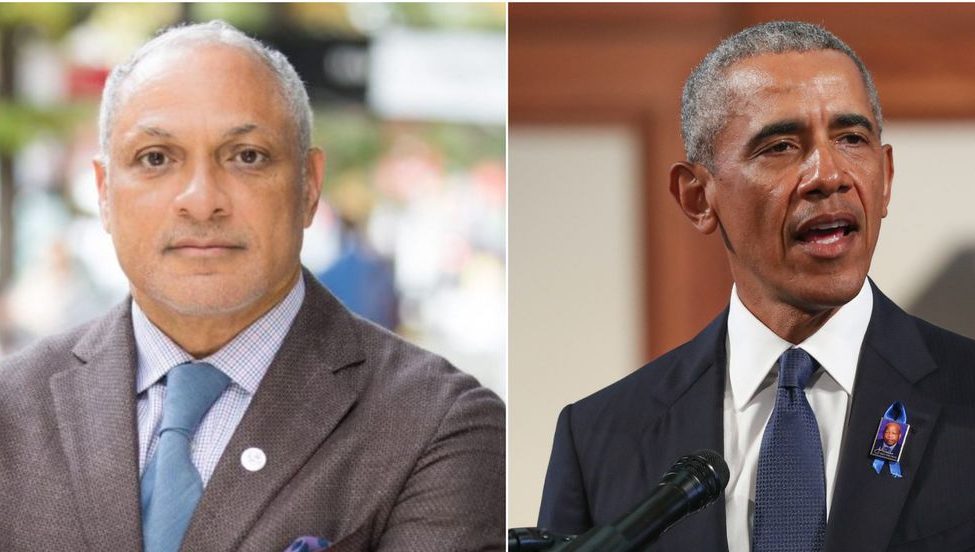
During the 2020 cycle, there’s been a storyline peddled by a fawning press and paid Democratic pollsters alike, both dedicated to pushing every Democratic storyline imaginable, that has gone something like this . . . Mike Espy can beat Cindy Hyde-Smith with an “Obama-like” turnout of black voters and the ability to pick up enough suburban white voters who are disaffected by Trump.
However, as we look to next Tuesday and what leading indicators we have at this point, there doesn’t seem to be a huge amount of data leading us to the likelihood of that. So, let’s look at the numbers.
First, to the core of the argument. Former President Obama when he against a pretty weak conservative Republican candidate in Mitt Romney in 2012, still lost Mississippi by a wide margin. He garnered 562,949 votes (43.79%) to Romney’s 710,746 votes (55.29%) with a total of 1.285 million voters.
In 2016, Donald Trump put up a huge number of votes (700,714 or 59%) over Hillary Clinton (485,131 or 41%) with voter turnout at 1.185 million voters. Even if Obama got 100% of his vote out in 2016, the top of the Democrat ticket would have still been underwater by 138,000 votes.
In 2018, Cindy Hyde-Smith, while not running a masterful campaign by any stretch, still handily beat Mike Espy by 68,000 votes (54% to 46%).
Now the real question is for 2020, with COVID and other dynamics, what will be the turnout in Mississippi? Unfortunately for Democrats, Joe Biden does not appear, based on publicly available polling, to be keeping the vote totals in Mississippi particularly close. Obviously tens of thousands of Mississippians, for health reasons or for voter intensity reasons, are taking advantage of absentee/earlier voting. But what data can be extracted to give us some indication of who’s voting early and why?
On 10/25, the Secretary of State released absentee voting numbers by county. For our analysis, we are opting to use Absentee Ballots Requested (as opposed to those completed or sent) because it at the very least signals voters’ intent to vote early
In an attempt to discern where the energy was, we took Absentee Ballots Requested by county and divided that into 2016 vote totals to see if blue counties or red counties registered any sort of advantage.
The 169,087 absentee ballots requested in 2020 represent 14.26% of all ballots cast in the 2016 Presidential race. The higher the percentage of absentee ballots requested in 2020 as a percentage of 2016 vote total would seem to indicate a higher level of voter intensity. Of the 26 counties above the overall average, 15 were counties that Trump won and 11 were counties that Clinton won in 2020. In the 15 red counties, 71,085 absentee ballots were requested. In the 11 blue counties, 28,922 absentee ballots were requested.
| County | Total | Trump | Trump % | Clinton | Clinton % | 2016 Total | 2020 Absentee 10/25/20 vs. 2016 |
| Washington | 4943 | 5,244 | 31.54% | 11,380 | 68.46% | 16,624 | 29.73% |
| Claiborne | 1109 | 540 | 12.71% | 3,708 | 87.29% | 4,248 | 26.11% |
| Lafayette | 4546 | 10,872 | 57.70% | 7,969 | 42.30% | 18,841 | 24.13% |
| Harrison | 13356 | 40,354 | 65.59% | 21,169 | 34.41% | 61,523 | 21.71% |
| Grenada | 2089 | 5,970 | 57.44% | 4,424 | 42.56% | 10,394 | 20.10% |
| Noxubee | 1033 | 1,200 | 21.63% | 4,347 | 78.37% | 5,547 | 18.62% |
| Jefferson | 708 | 490 | 12.80% | 3,337 | 87.20% | 3,827 | 18.50% |
| Greene | 964 | 4,335 | 81.65% | 974 | 18.35% | 5,309 | 18.16% |
| Leflore | 1986 | 3,212 | 29.20% | 7,787 | 70.80% | 10,999 | 18.06% |
| Benton | 707 | 2,251 | 56.70% | 1,719 | 43.30% | 3,970 | 17.81% |
| Montgomery | 875 | 2,818 | 57.13% | 2,115 | 42.87% | 4,933 | 17.74% |
| Rankin | 10861 | 47,178 | 76.98% | 14,110 | 23.02% | 61,288 | 17.72% |
| Pike | 2756 | 8,009 | 49.89% | 8,043 | 50.11% | 16,052 | 17.17% |
| Adams | 2301 | 5,874 | 43.09% | 7,757 | 56.91% | 13,631 | 16.88% |
| Winston | 1434 | 4,910 | 56.05% | 3,850 | 43.95% | 8,760 | 16.37% |
| Hancock | 2793 | 13,811 | 80.51% | 3,344 | 19.49% | 17,155 | 16.28% |
| Pearl River | 3455 | 17,782 | 83.15% | 3,604 | 16.85% | 21,386 | 16.16% |
| Jeff Davis | 977 | 2,466 | 39.86% | 3,720 | 60.14% | 6,186 | 15.79% |
| Hinds | 14413 | 25,275 | 27.22% | 67,594 | 72.78% | 92,869 | 15.52% |
| DeSoto | 9798 | 43,089 | 67.66% | 20,591 | 32.34% | 63,680 | 15.39% |
| Madison | 7414 | 28,265 | 58.15% | 20,343 | 41.85% | 48,608 | 15.25% |
| Sharkey | 331 | 692 | 31.87% | 1,479 | 68.13% | 2,171 | 15.25% |
| Quitman | 501 | 1,001 | 30.21% | 2,312 | 69.79% | 3,313 | 15.12% |
| Jackson | 7202 | 33,629 | 69.65% | 14,657 | 30.35% | 48,286 | 14.92% |
| Warren | 2835 | 9,767 | 51.27% | 9,284 | 48.73% | 19,051 | 14.88% |
| Humphreys | 620 | 1,151 | 27.26% | 3,071 | 72.74% | 4,222 | 14.68% |
What that would seem to indicate is that, at the very least, there’s not a huge “blue wave” bubbling under the surface in Mississippi. While predicting overall voter turnout is tricky, particularly in the age of COVID, my general sense is that the number of voters may exceed 2016 and approach or maybe even marginally exceed 2012 numbers. But there appears to be about the same amount of voter intensity among Republicans as there are among Democrats here. The big question is whether the substantial uptick in early voting, a phenomenon seen around the country, indicates massive increases in overall voter turnout or simply a shift in how voters are voting. And we won’t know that till election day.
To beat Cindy Hyde-Smith, the Republican incumbent senator in Mississippi, Espy would have to outperform Obama and drag tens of thousands of Trump voters and have turnout that in fact exceeded Obama’s 2012 campaign in Mississippi. That’s a really tall order, but November 3 will be here before we know it.
There’s no doubt that a mountain of outside money has come in to move the US Senate race in Mississippi. The question is, has it actually moved voters? Looking at the absentee numbers, it would be hard to point to hard data that indicates a groundswell that’s been moved by the money to this point.
But no matter what, go vote.
